
Every consultant in dentistry hands you the same number: 61% overhead. The ADA Health Policy Institute even backs it — a mean expense of about 61.3% for a general practice. [link to ADA HPI source]
So you pull your books, land at 62%, call it normal, and move on.
Three problems. All quiet. All expensive.
Is a “good” dental overhead percentage even comparable?
First — you’re not even comparing the same thing. There’s no standard for what “overhead” includes. One office measures it against production, the next against collections. One folds in associate pay and debt service, the next strips both out. Hold your 62% against someone’s 58% and you’re not comparing apples to oranges — you’re comparing apples to aardvarks. Two thermometers on different scales reading the same patient.
So stop comparing outward. The only overhead number that means anything is your own, tracked over time, on a definition you set and never change. This quarter, compared to last, tells you something real. The benchmark never will.
Why can your overhead change when nothing changed?
Second — it’s just a ratio, and a ratio has two handles. Overhead is expenses over collections. Raise your fees and the percentage drops — you didn’t cut a thing. Have one slow collections month, and it spikes — you didn’t spend an extra dollar. The number moves for reasons unrelated to how you run the place. You can “fix” your overhead on paper without touching a single real cost.
Why overhead only tells you the past
Third — it’s the biggest lag indicator in your practice. It tells you what already happened — last year’s prices, last year’s contracts, last year’s decisions — and nothing about what to change, or how. By the time the number moves, the decision that moved it is months behind you.
The ADA’s own data proves it: over five years, expenses rose 4.9% while revenue rose just 1.4%, and real income for general dentists has fallen for fifteen years. [link to ADA HPI source] The percentage looked “normal” the entire way down. A lag indicator always does.
What to track instead of the overhead percentage
I don’t read the number. I read the levers underneath it — the parts you can actually decide on:
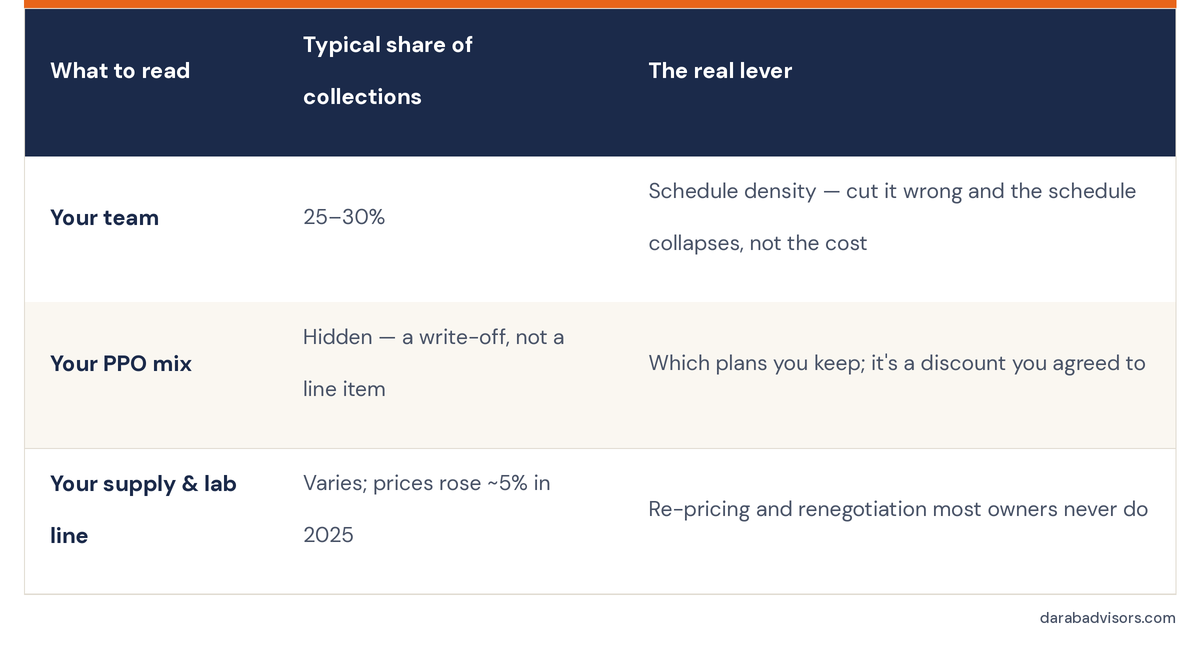 The percentage is the symptom. The components are the diagnosis. An owner stares at one number and cuts the hygiene column. A surgeon diagnoses first — then cuts sharply.
The real question to ask
Stop asking “is my overhead too high.” Start asking “what’s my next move — and what will it free up?”
That’s the decision before the decision. And once you stop chasing the percentage, the next question is the honest one: did the practice actually make money? That’s a different number entirely — EBITDA, and for a solo practice, SDE — and it’s the subject of a future post.
Frequently asked questions
What is a normal overhead percentage for a dental practice? The ADA Health Policy Institute puts mean general-practice expenses around 61%. But that figure isn’t directly comparable from office to office, because there’s no standard definition of what overhead includes.
Should I measure overhead against production or collections? Collections is the more honest denominator, since production you never collect isn’t money. Whichever you choose, the rule is to pick one definition and never change it — your trend matters more than any benchmark.
How do I actually lower my dental overhead? Work the components, not the percentage: team scheduling, PPO mix, and supply/lab pricing. Or grow collections past your fixed costs — there’s a floor under cost-cutting, but no ceiling on growth.
Is overhead the best measure of practice health? No. It’s a lag indicator — useful as a smoke alarm, useless as a diagnosis. EBITDA and SDE tell you whether the practice actually earns money; overhead only tells you something moved.
About the author: David Darab, DDS, MBA, is a former practice owner of 33 years and the founder of Darab Business Advisors. He helps independent dental practice owners find hidden cash flow and decide whether to stay, scale, slow down, or sell. www.darabadvisors.com
Take the free What’s Next Assessment — answer a few questions and get your number plus the first move.